Confirming payment details

Payment processing
Login or Sign up
Forgot password
Enter your email address and we will send you a password reset link or need more help?
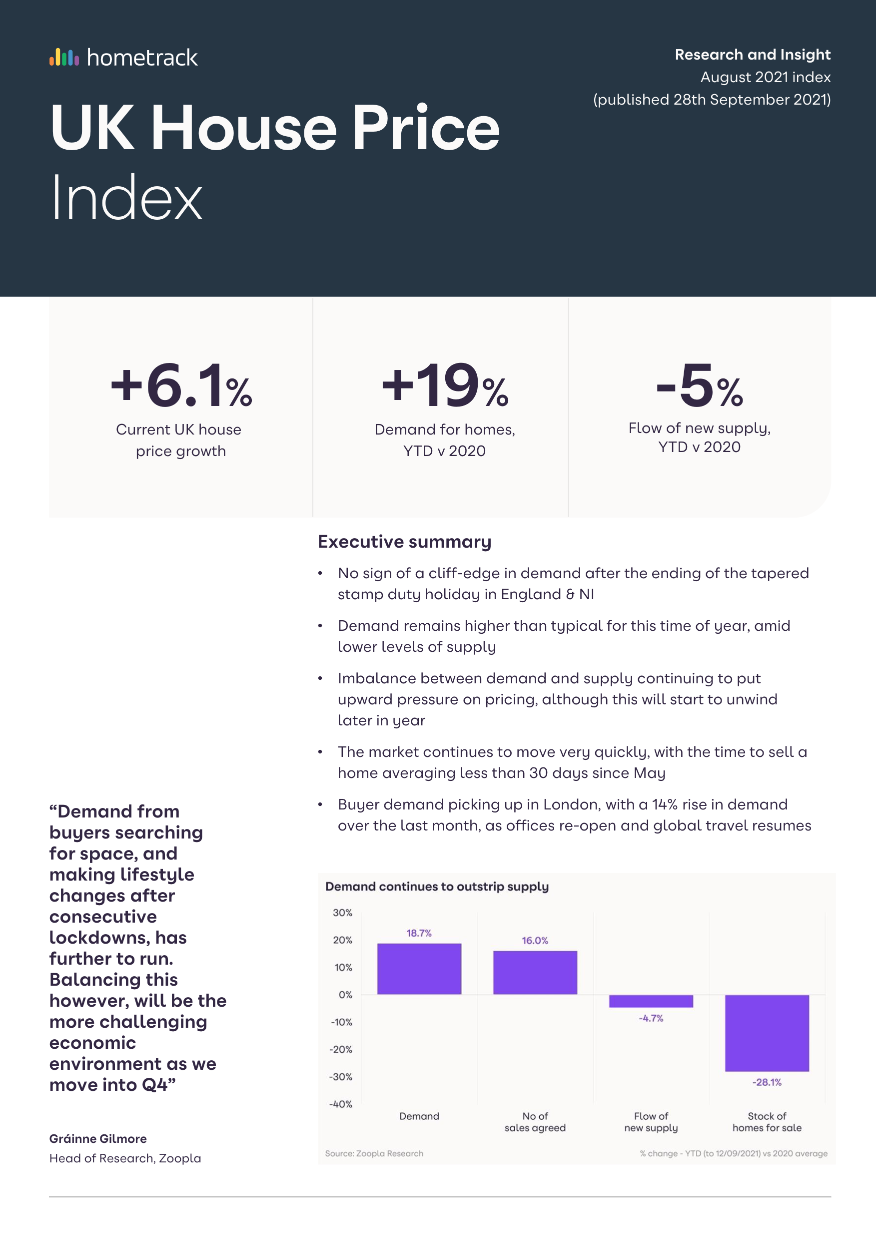
UK House Price Index – August 2021
By Richard Donnell on 28 September 2021- No sign of a cliff-edge in demand after the ending of the tapered stamp duty holiday in England & NI
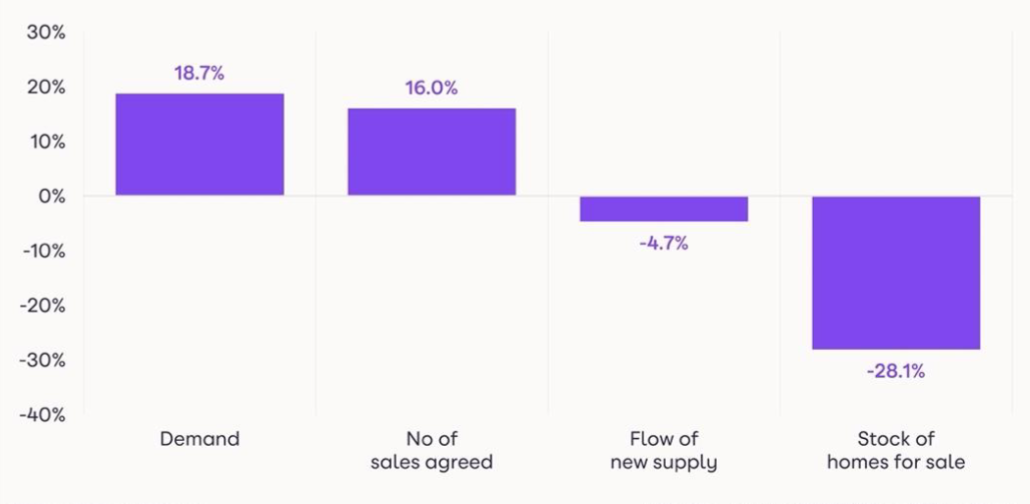
- Demand remains higher than typical for this time of year, amid lower levels of supply
- Imbalance between demand and supply continuing to put upward pressure on pricing, although this will start to unwind later in year
Demand from buyers searching for space, and making lifestyle changes after consecutive lockdowns, has further to run. Balancing this however, will be the more challenging economic environment as we move into Q4.
Annual UK house price inflation at +6.1%
Average house price rose by +1.2% in the three months to the end of August, taking the annual rate of price growth to +6.1%, up from 2.8% in August 2020.
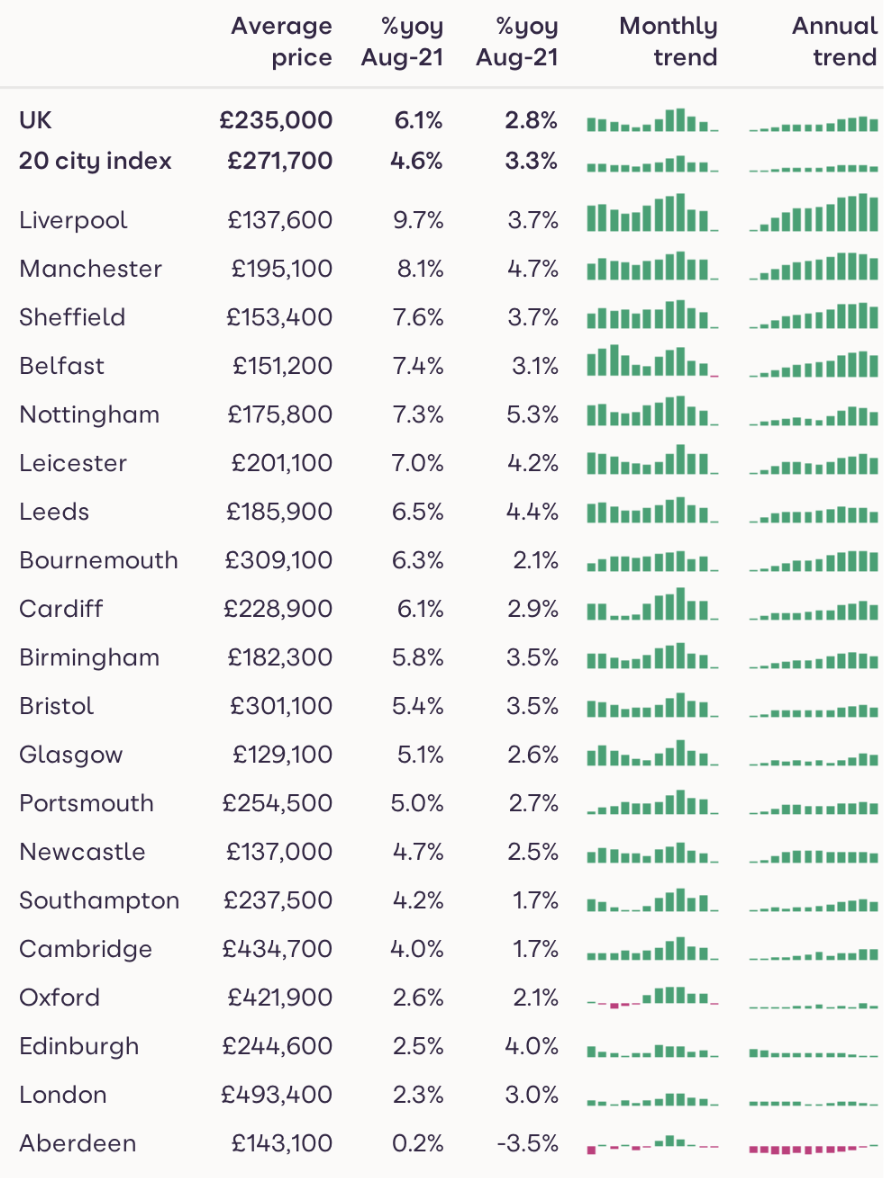
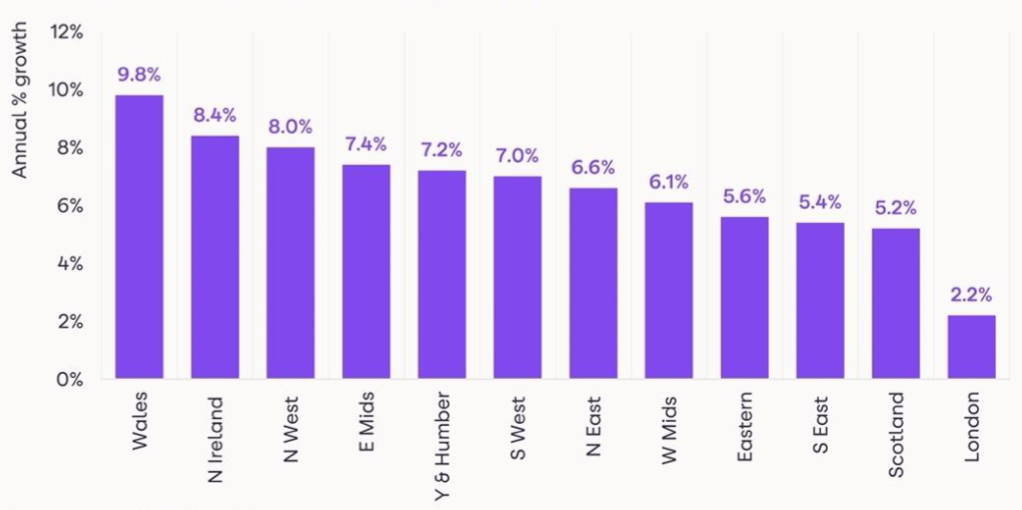
The average value of a home across the UK is now £235,000. As has been the case for six months, Wales is recording the highest level of price growth at +9.8%, followed by Northern Ireland (+8.4%) and the North West of England (+8%).
Price growth in Liverpool continues to be the highest among the UK’s major cities, with average prices up +9.8% in the 12 months to September. Manchester and Sheffield are also registering high levels of growth, at +8.1% and +7.6% respectively.
Bringing up the rear in terms of house price growth is London, with average values up 2.2% on the year, below inflation. As examined in previous reports, in the face of the very strong buyer demand evident since May last year, average home values have risen by a greater margin in regions and towns where relative affordability is greater.
London is the region which has the greatest affordability constraints, with the average house price now above half a million pounds.
In addition, demand levels have also trailed in parts of London over the last 18 months due to the lack of international travel, and slower domestic demand as a cohort of buyers looked to move into the wider commuter zone or further afield amid a new flexible working environment.
There are now signs that this trend is starting to turn, with buyer demand in the capital up 14% over the last month. This translates into a 25% rise in demand for houses across London and a 6% rise in demand for flats, as life continues to return towards normality.
Limited impact of tapered stamp duty holiday ending
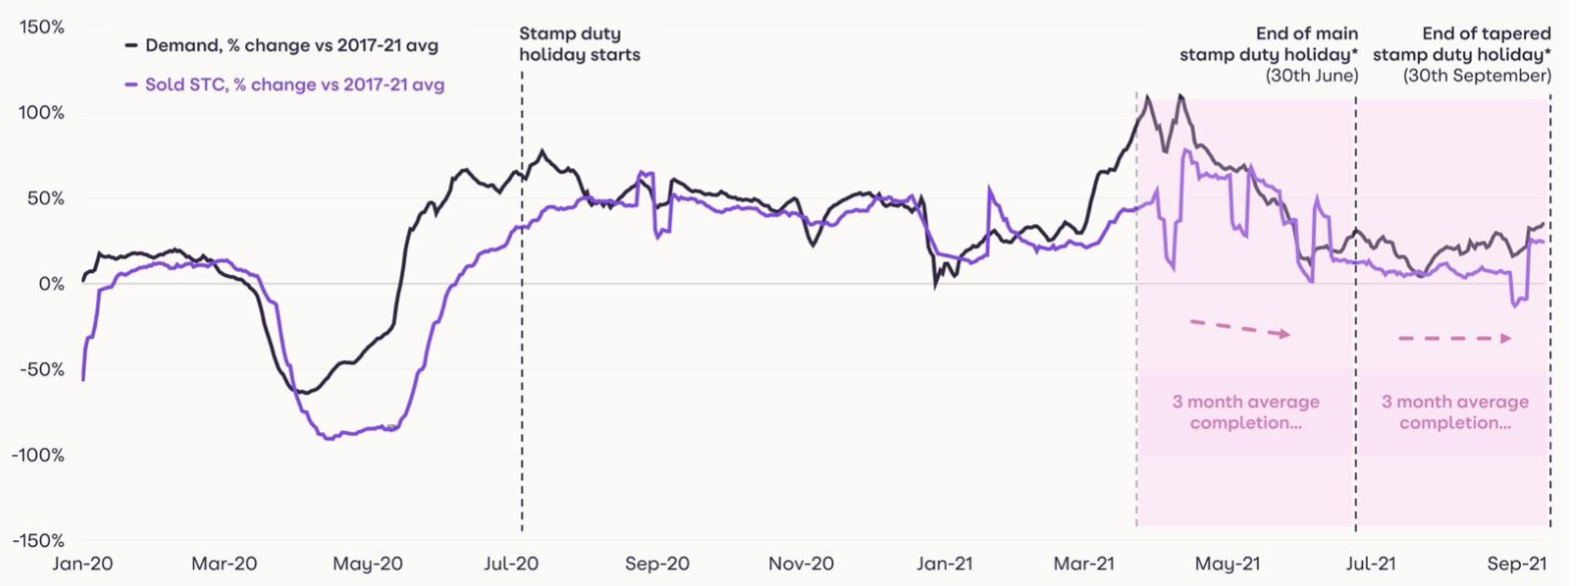
The impact of the first ‘main’ stamp duty holiday ending at the end of June had an impact on demand and sales (sold subject to contract) levels.
The fall in both metrics can be seen around March/April time, when buyers would have had to agree a sale in order to complete their purchase by the end of June and take advantage of the stamp duty savings of up to £15,000.
Even though buyer demand receded in Q2 , it still stayed high compared to historical norms, albeit at more sustainable levels. However, looking at late June/July for the potential impact of the withdrawal of the ‘tapered’ stamp duty holiday at the end of September – there is little evidence of a change to buyer behaviour.
Buyers agreeing a sale from July onwards are unlikely to benefit from the savings of up to £2,500 available for completions made by September 30th due to the time taken to complete a sale.
Yet the data shows the looming deadline had little impact on demand around this time. Buyer demand is still some 35% higher than average levels recorded since 2017.
This indicates that the smaller stamp duty savings on offer have not been the primary driver of demand in the market.
This underlines the importance of some wider trends in the market – namely the pandemic-driven re-evaluation of home and the resulting ‘search for space’ – trends that we believe have further to run into Q4.
Rapidly moving markets
Any expectation of a slowdown in the market as the stamp duty holiday ends is further quashed when examining how quickly homes are selling.
Since May this year, the average time taken for a sale to be agreed on a property from when it was listed has been below 30 days.
This measure of the speed of the market may start to edge up in the coming months as a lack of stock starts to have more of a ‘self-limiting’ impact on the market.
Even so, it’s likely that properties will sell more quickly than historical norms through Q4.
While the overall stock of housing available to buy is lower than typical levels, there are signs that some supply is coming from the rental market, as a higher proportion of landlords sell.
Around 8% of properties listed for sale have been rented out in the last 3 years, up from 3% two years ago.
The proportion reaches 13% in London. Some landlords may be crystalising gains to reinvest - demand from investors has certainly risen since the start of the pandemic.
Outlook
The ending of the ‘tapered’ stamp duty holiday has had little impact on buyer demand which remains higher than typical levels for this time of year.
The demand coming from buyers searching for space, and making lifestyle changes after consecutive lockdowns, has further to run.
Balancing this however, will be the ending of government support for the economy via furlough, and more challenging economic conditions overall, which we believe will have an impact on market sentiment as we move through Q4.
We expect the market to remain busy compared to historical norms, and for price growth to remain in firmly positive territory at the end of the year, although lower than current levels of +6.1%.
Stock levels will start to rebuild in early 2022 as market activity returns to more normal levels.
UK House Price Index – August 2021
By Richard DonnellRelated articles
Sellers need to remain realistic on where they set the asking price if they are to take advantage of improving market conditions to secure a sale and move home in 2024.
After a busy start to 2022, the market will start to move back to pre-pandemic conditions, allowing supply pipelines to rebuild. However, the demand/supply imbalance will not fully unwind, and this will be one factor supporting price growth of 3% next year.
House price growth is starting to ease, although the path over the next year will not be linear. We expect UK average price growth to end 2022 firmly in positive territory at 3%.
The impact of the pandemic has further to run. The current momentum in the market will largely offset growing headwinds over 2022 with average UK house prices increasing by 3% and 1.2m sales.

Subscribe to receive email updates.
HometrackGlobal:
Linked In: