Confirming payment details

Payment processing
Login or Sign up
Forgot password
Enter your email address and we will send you a password reset link or need more help?
UK House Price Index – March 2024
By Richard Donnell on 01 April 2024- Annual house price inflation slows to -0.3%, up from -1.4% in Oct 23
- Market activity improves across all key measures led by sales, which are 9% higher than a year ago
- More sellers coming to market and stock of homes for sale up 20%
Sellers need to remain realistic on where they set the asking price if they are to take advantage of improving market conditions to secure a sale and move home in 2024.
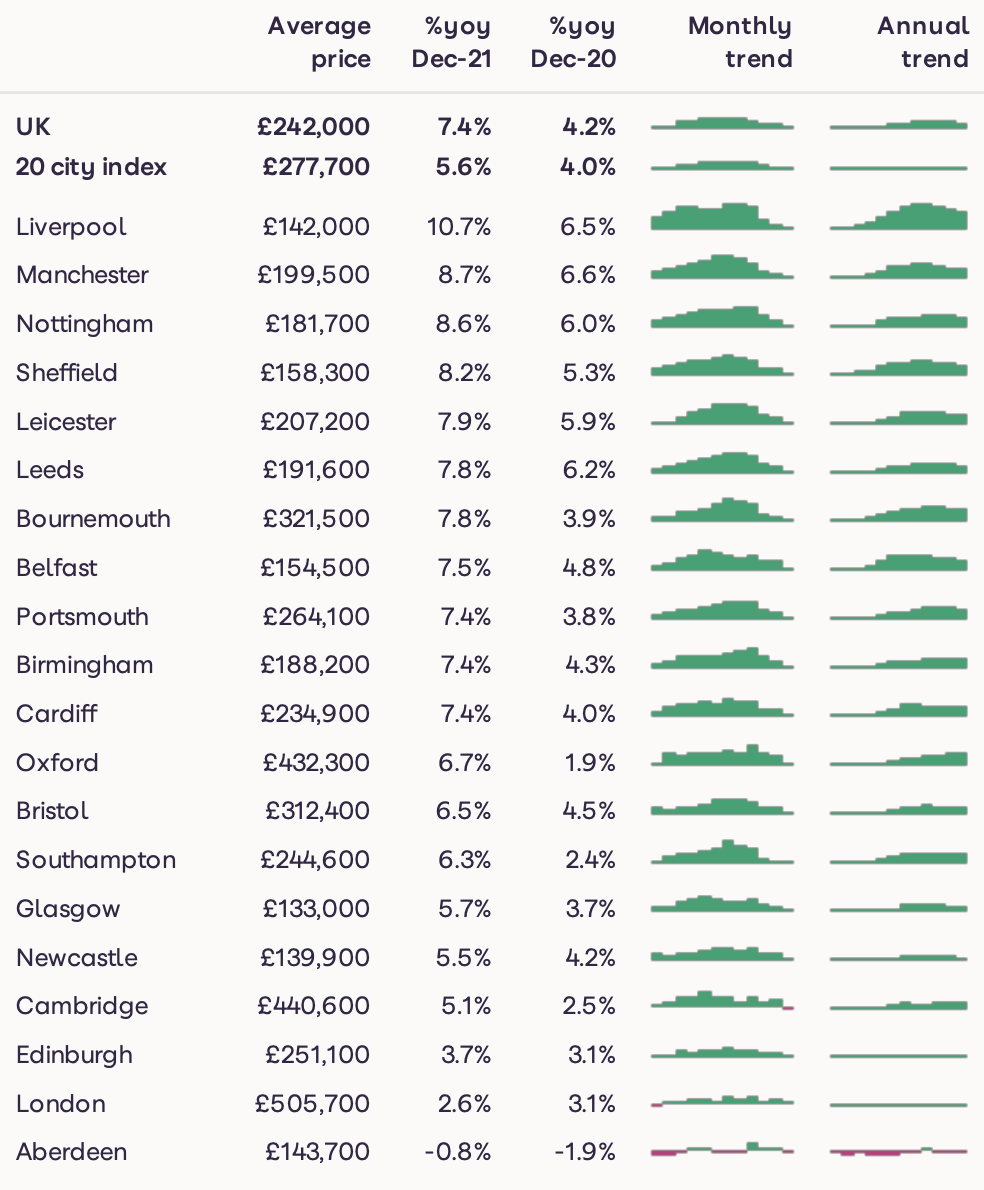
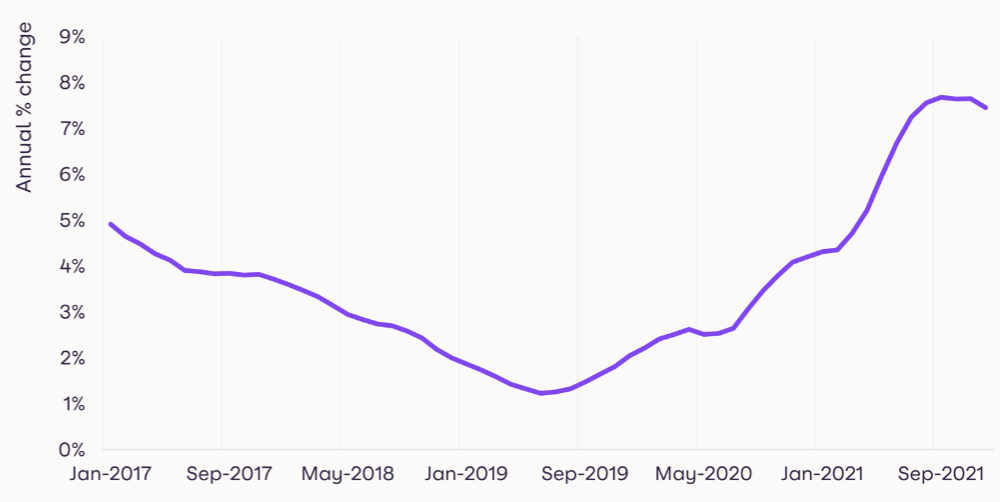
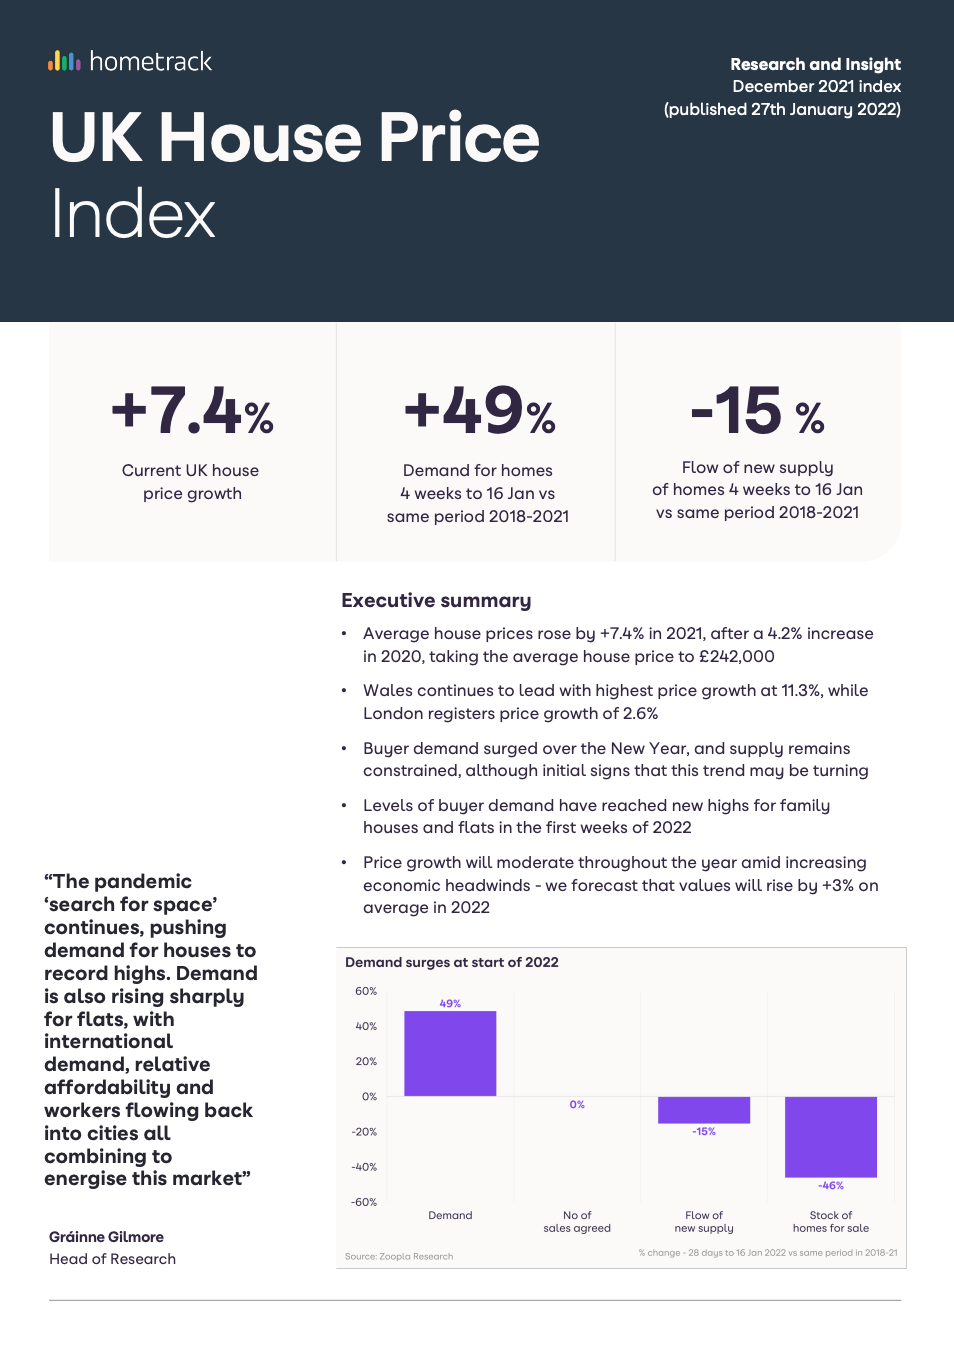
UK house price inflation at 7.4%
Average UK house prices rose by 1% in the three months to December, taking the rate of annual growth to 7.4%, down from 7.7% in September. This value of an average home is at £242,000, a rise of £17,000 during 2021.
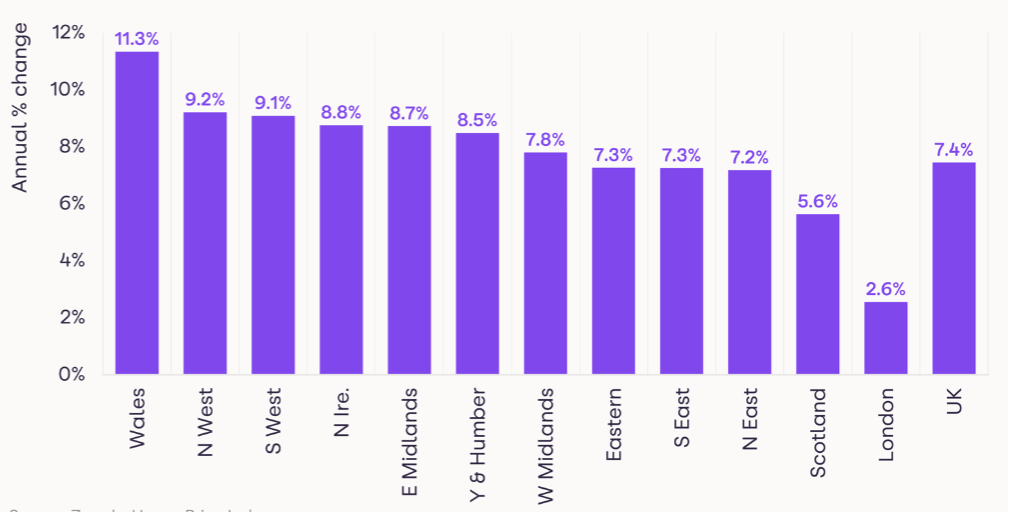
Wales is registering the highest rate of house price growth, for the tenth consecutive month.
Prices are up 11.3% in the country, with average values in Powys, Carmarthenshire and Neath Port Talbot rising by 14.4%, 13.7% and 13.4% respectively as the desire for more space and the relative affordability of these markets has pushed up demand.
Liverpool and Manchester lead the way in terms of price growth in the UK’s largest cities, at 10.7% and 8.7%, contributing to average growth of 9.2% in the North West.
Oldham and Rochdale are also registering growth of more than 11%. At the other end of the scale, London’s home values are up by an average of 2.6%, although in a third of the city’s boroughs including Bromley, Bexley and Havering, price growth is over 4%.
Demand rises for all property types
Several factors combined in 2021 to drive demand for family homes.
The pandemic ‘search for space’, the stamp duty holiday – where larger savings were available for higher value transactions, and also changing working patterns for office-based workers all contributed to a strong focus on family homes, especially in the wider commuter zones and in rural areas.
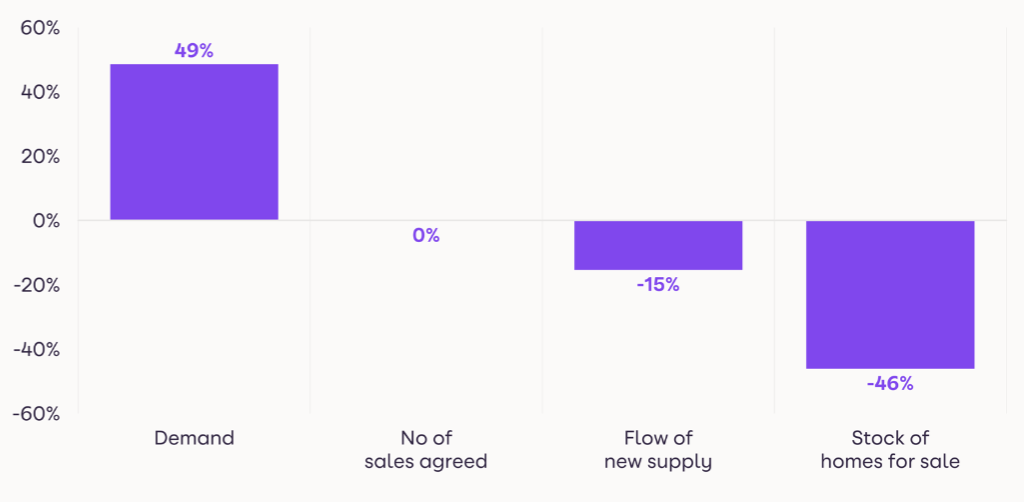
As we forecast in early December, buyer demand bounced back strongly at the start of this year, up 50% compared to usual levels for this time of year.
Some of the strongest demand has been seen in cities and wider suburbs, including Thurrock in Essex, the suburbs of Birmingham and Glasgow and East London (Barking & Dagenham) leading the way.
Demand for flats has also risen sharply, as the chart below shows. The flats markets outside London has been driven by the re-opening of offices, as well as more buyers considering the value in flats, with average flat prices up just 1.9% over the last year across the UK’s 20 major cities.
In contrast, the average value of a detached family home in these cities is up 8%. Agents have also reported increased interest from investors and homebuyers from overseas signalling some pent-up demand coming back.
The London market is particularly driven by international demand, so the increasing ease of global travel have spurred those purchasing as an investment and those buying to live.
Average demand for London apartments at the highest level since April 2020. The average value of a flat in London has remained largely unchanged over the last 12 months, while the average price of a semi-detached house has risen by 6%, signalling value in the flats market.
Supply levels starting to turn
The lack of supply of homes for sale coming to the market has been a major theme of the housing market since the pandemic started.
The sheer level of activity, with 1.5 million sales in 2021 – the highest number of transactions in any year since before the financial crisis, has eroded supply.
In addition, increased activity amongst first-time buyers, who were offered a way in to the market due to higher LTVs last year, and also investors, who were taking advantage of the stamp duty holiday, meant that there was more ‘pure demand’ in the market. There is still a significant imbalance between supply and demand.
Looking at stock levels against a five-year average, they are -44% lower. However, this marks a slight turn around from late in 2021, when stock levels were down -47%.
This is a relatively small change, but new supply coming to the market is tracking usual levels at this time of year, and valuation leads have jumped in the first few weeks of the year, signalling that supply levels could start to build this year, especially as the busy New Year period passes.
It is worth noting however that sales agreed are also tracking usual levels, signalling that even with lower levels of stock, the number of committed buyers and sellers is allowing activity to progress, especially where agents are helping to identify properties for would-be sellers to move into.
While demand continues to outstrip the supply, there is now more balance by type of home, with three-bed houses topping both charts. In the previous four-week period, the most listed properties were 2-bed flats, at odds with the largest demand still being family houses.
Mortgage rates at a low base
As we have highlighted in recent months, there are economic headwinds ahead this year, not least rising inflation which will lead to a rise in the Bank of England base rate, and in mortgage rates.
Rising mortgage rates will make buying a home more expensive on a monthly basis for those purchasing a home. It is worth placing this in a longer-run context.
Mortgage rates are currently at ultra-low levels, so even with some quarter point increases, they will remain relatively low, especially as lenders are competing for business.
For those who already own a home, around three-quarters of owners have a fixed-rate mortgage deal, so they will be protected from any rate rises for some time.
Outlook
There is still a significant imbalance between demand for homes and the supply of homes for sale which will continue to put upwards pressure on prices, offsetting some of the economic headwinds ahead.
As outlined in our forecasts report, we expect home values to rise by an average of 3% this year, ranging from 2% in London and 4% in the North West and East Midlands.
We also forecast 1.2 million transactions, down from 1.5 million last year, but in line with the average number of transactions over the last five years
UK House Price Index – March 2024
By Richard DonnellRelated articles
After a busy start to 2022, the market will start to move back to pre-pandemic conditions, allowing supply pipelines to rebuild. However, the demand/supply imbalance will not fully unwind, and this will be one factor supporting price growth of 3% next year.
House price growth is starting to ease, although the path over the next year will not be linear. We expect UK average price growth to end 2022 firmly in positive territory at 3%.
The impact of the pandemic has further to run. The current momentum in the market will largely offset growing headwinds over 2022 with average UK house prices increasing by 3% and 1.2m sales.
Demand from buyers searching for space, and making lifestyle changes after consecutive lockdowns, has further to run. Balancing this however, will be the more challenging economic environment as we move into Q4.

Subscribe to receive email updates.
HometrackGlobal:
Linked In: