Confirming payment details

Payment processing

Login or Sign up
Forgot password
Enter your email address and we will send you a password reset link or need more help?
UK Cities House Price Index - August 2018
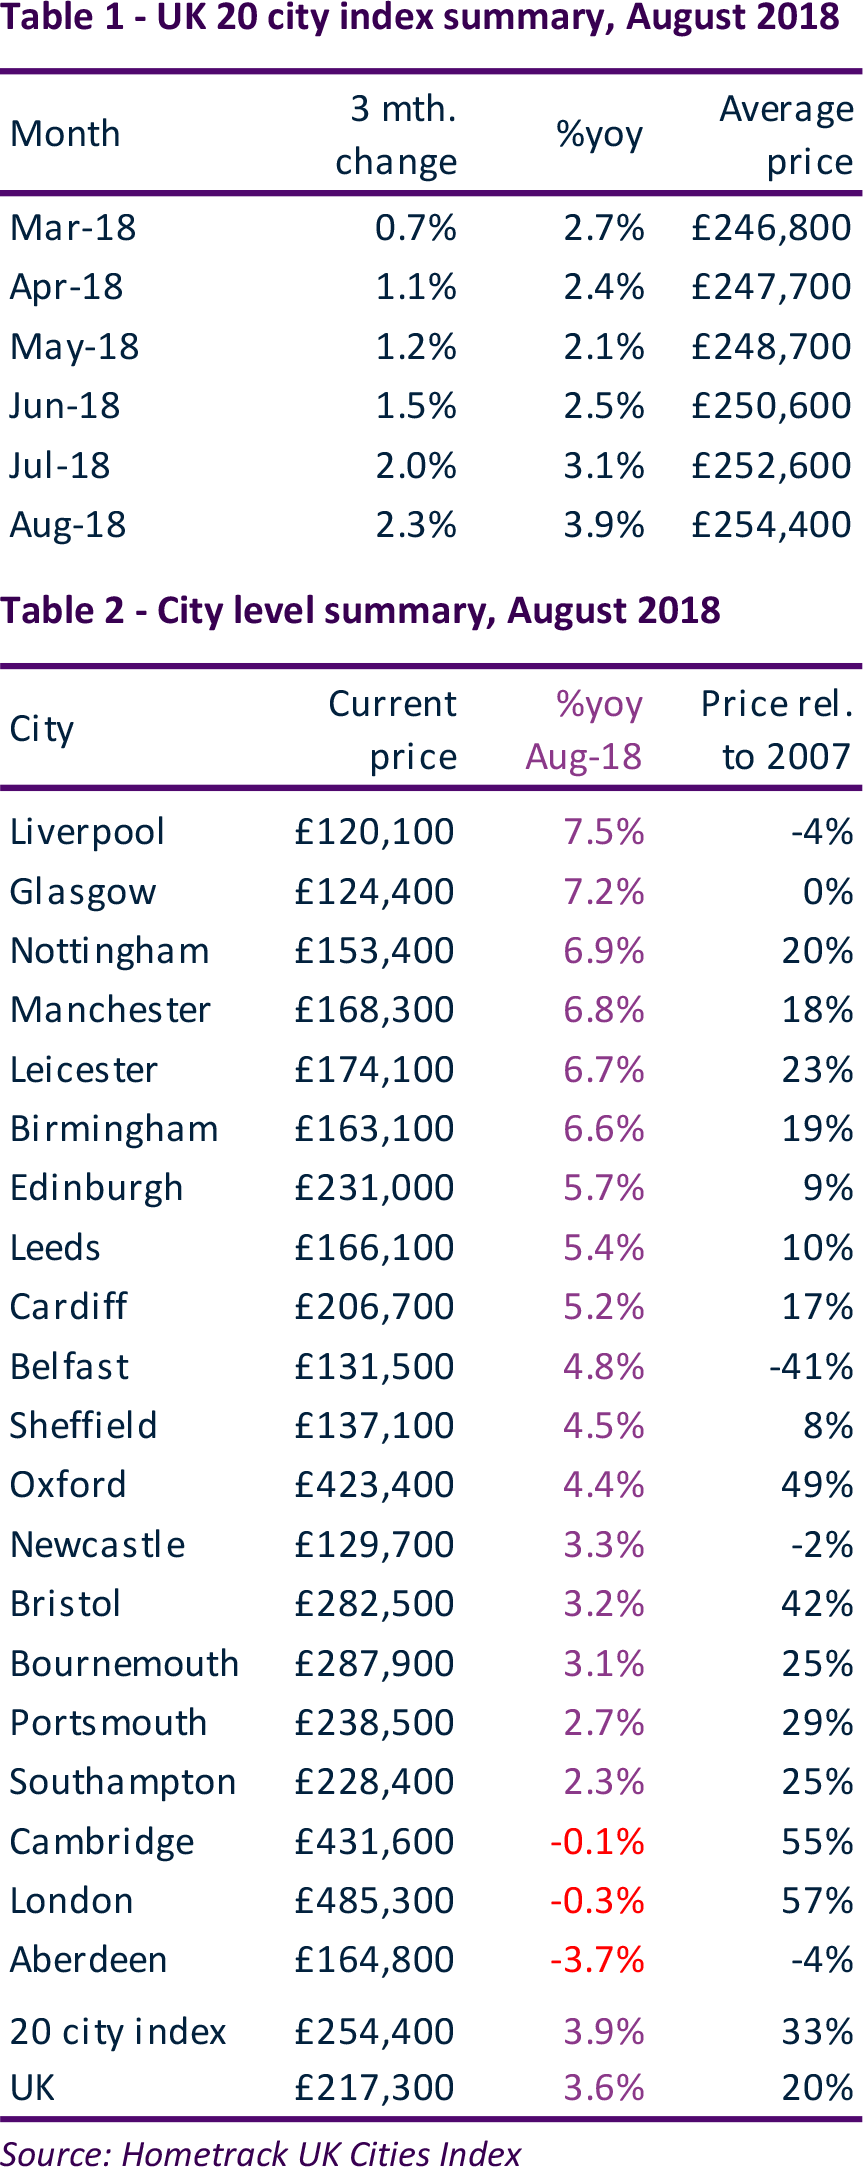
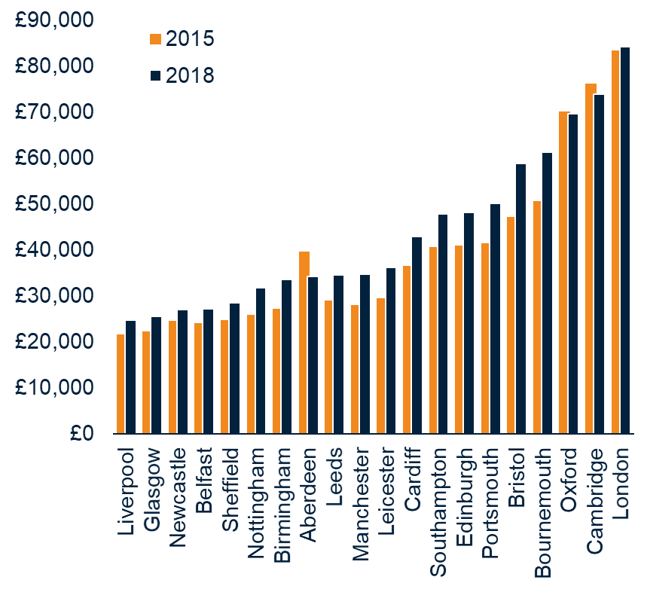
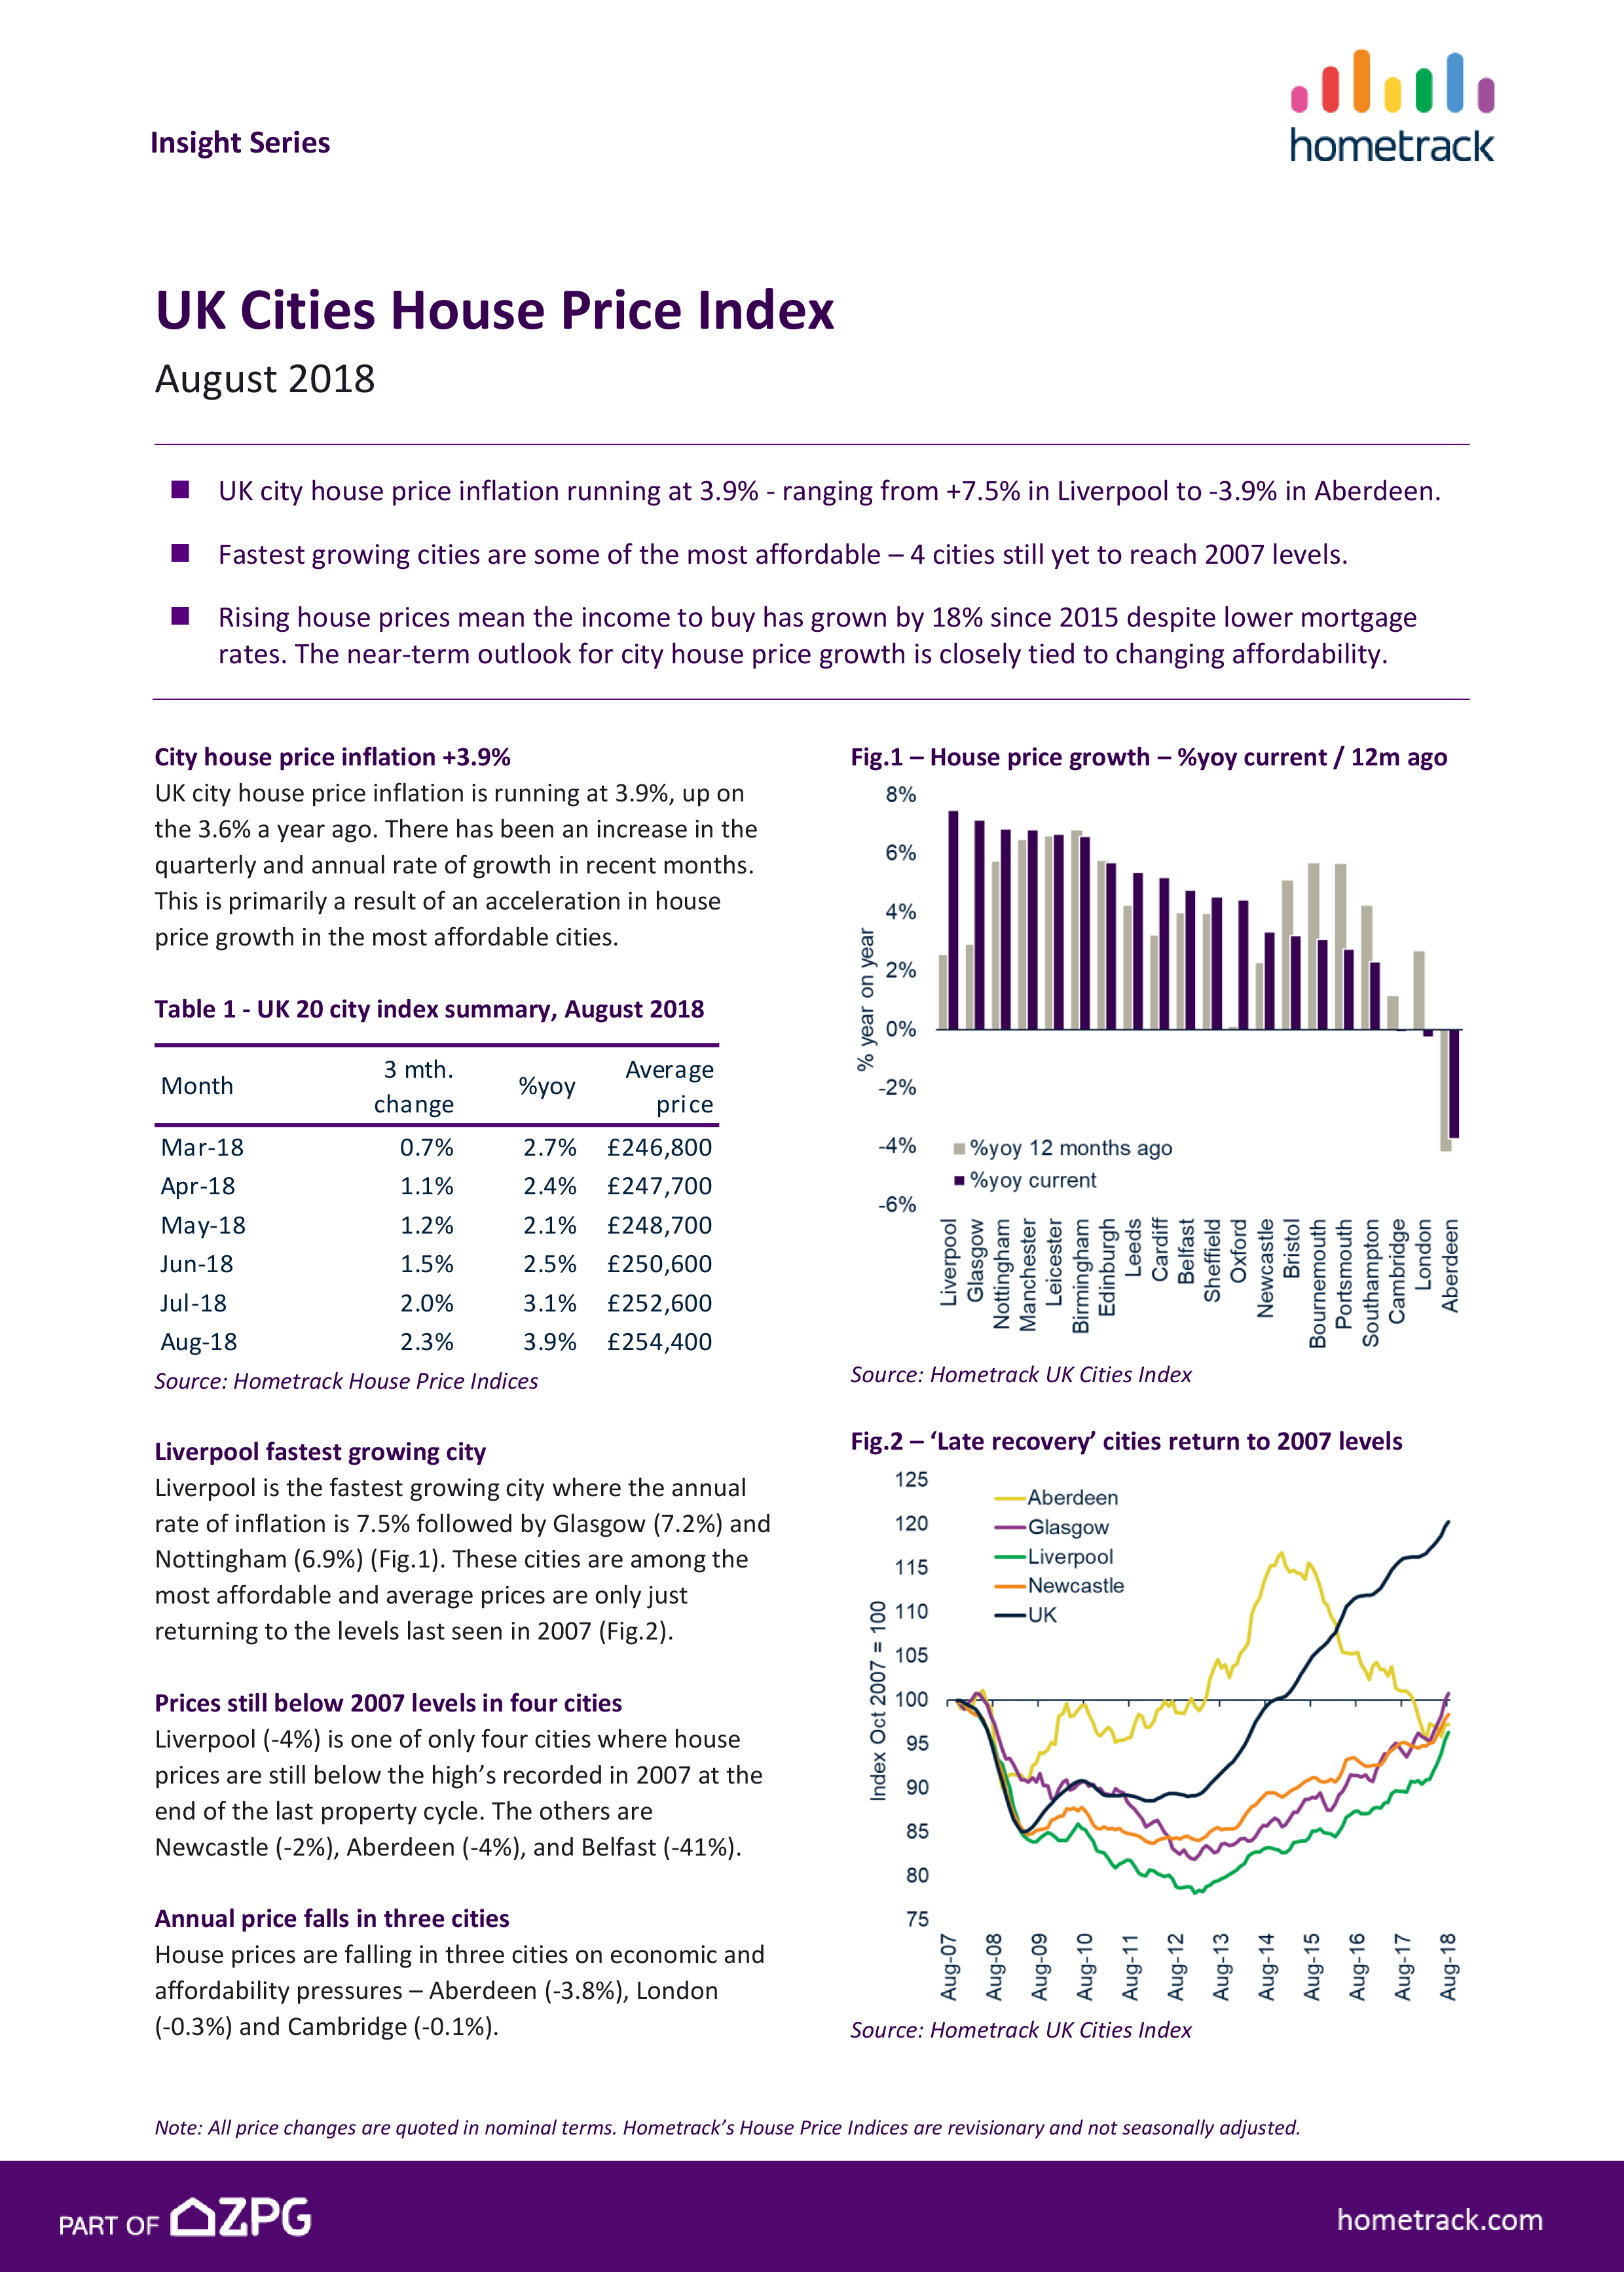
On 27 September, 2018- UK city house price inflation running at 3.9% - ranging from +7.5% in Liverpool to -3.9% in Aberdeen.
- Fastest growing cities are some of the most affordable – 4 cities still yet to reach 2007 levels.
- Rising house prices mean the income to buy has grown by 18% since 2015 despite lower mortgage rates. The near-term outlook for city house price growth is closely tied to changing affordability.
The impact on the UK economy of a hard or ‘no deal’ Brexit, and the knock-on impact for the housing market, has been a topic of much debate recently. Despite uncertainty around Brexit compounding the market slowdown in London, our analysis of income to buy indicates there is further scope for price growth in the most affordable cities, where prices are currently rising fastest.
City house price inflation +3.9%
UK city house price inflation is running at 3.9%, up on the 3.6% a year ago. There has been an increase in the quarterly and annual rate of growth in recent months. This is primarily a result of an acceleration in house price growth in the most affordable cities.
Liverpool fastest growing city
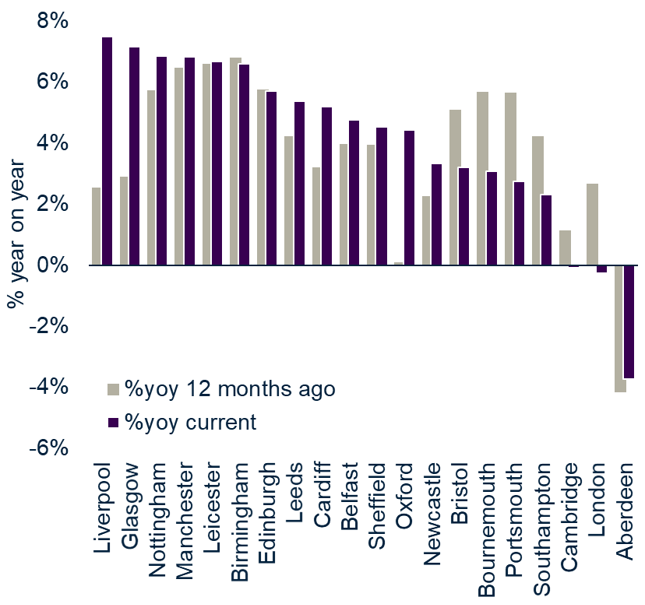
Liverpool is the fastest growing city where the annual rate of inflation is 7.5% followed by Glasgow (7.2%) and Nottingham (6.9%) (Fig.1). These cities are among the most affordable and average prices are only just returning to the levels last seen in 2007 (Fig.2).
Prices still below 2007 levels in four cities
Liverpool (-4%) is one of only four cities where house prices are still below the high’s recorded in 2007 at the end of the last property cycle. The others are Newcastle (-2%), Aberdeen (-4%), and Belfast (-41%).
Annual price falls in three cities
House prices are falling in three cities on economic and affordability pressures – Aberdeen (-3.8%), London (-0.3%) and Cambridge (-0.1%).
Aberdeen prices falling for 3 years
Despite the recent increase in the oil price, average house prices in Aberdeen continue to decline and have been falling for exactly 3 years. From a recent high of £198,000 in December 2014, house prices have fallen back to £164,000, a decline of 17%, wiping out similar sized gains made between 2012-2014. This highlights how local economic shocks can result in price falls, even though house prices are growing nationally.
Weaker growth - Brexit or market fundamentals?
The impact on the UK economy of a hard or ‘no deal’ Brexit, and the knock-on impact for the housing market, has been a topic of much debate recently. Some have questioned the extent to which the recent slowdown in house price growth is down to growing uncertainty since the Referendum in June 2016.
The impact of Brexit on jobs, investment, migration, economic growth and mortgage rates are unknown although there are many scenarios with a wide range of potential outcomes.
The worst-case scenario reported recently from the Bank of England is driven by an increase in interest rates and mortgage rates - the housing market is becoming increasingly sensitive to higher mortgage rates, especially in southern England where there has been a direct impact on what buyers are prepared to pay for housing. It will also have an impact on what investors are prepared to pay for housing. An increase in borrowing costs will mean they have to adjust the yield they want from housing by paying less for a home assuming no change in rent levels.
So far, Brexit has compounded the London slowdown
National data for housing sales and mortgage approvals for home purchase have remained broadly flat since 2015. The slowdown in sales volumes and house price inflation has been focused on south eastern England, and primarily London.
In our view, the Referendum result was a compounding factor for the slowdown in London house price growth since 2015. The primary drivers were stretched affordability, the impact of lending regulations (loan to income thresholds and affordability testing) and housing related tax changes e.g. stamp duty.
House prices rising faster than earnings in 16 cities
The reality is that house prices continue to rise faster than earnings in 16 cities as buyers continue to bid up the cost of housing on the back of low mortgage rates and high levels of employment.
Higher prices impact affordability and spending power
Higher house prices, combined with drift upwards in mortgage rates, means affordability pressures are likely to continue to increase steadily in the next 12-24 months and act to moderate the rate of growth.
Mortgage regulations limit borrowing
Loan-to-income thresholds are already limiting the extent to which borrowers can take on debt to boost buying power, primarily in higher value cities. This is one reason why house price growth in London is flat at the headline level and falling in central areas.
First-time buyer income to buy up 18% since 2015
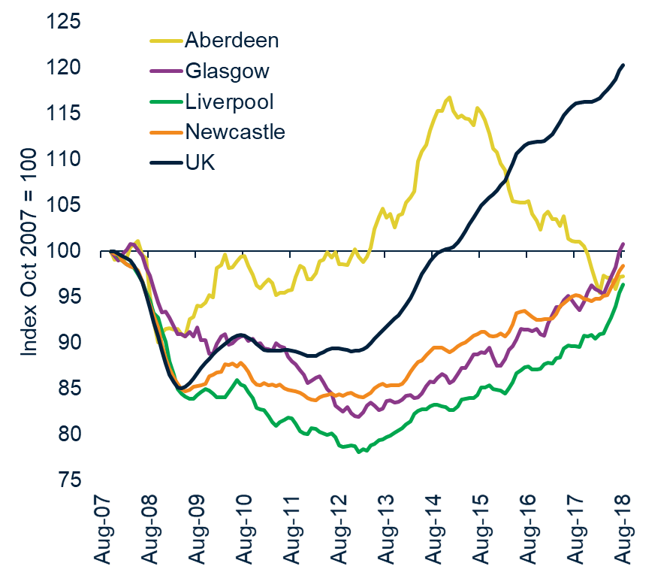
To highlight how housing affordability is developing, we have calculated the income required by a typical first-time buyer to purchase an average priced property in 2015 and 2018 (Fig.3). While mortgage rates have fallen since 2015, the income to buy has increased by an average of 18% and by as much as 24% in Bristol.
Income to buy outright range from £25k to £82k
The gross household income to buy an average home outright ranges from £25,000 in Liverpool to £82,000 in London. It is no surprise that prices are flat or falling in the most unaffordable markets, where deposits are also highest.
What is clear is that the rate of price growth is slowing in cities beyond London where the income to buy is also relatively high and increasing – for example in cities along the south coast of England (Fig. 1).
Room for price growth in most affordable cities
While the income to buy has risen across all but the most expensive cities, it remains at or around the national average income across half of the cities. In our view, these have further scope for price growth and are some of the cities where prices are currently rising fastest.
UK Cities House Price Index - August 2018
Related articles
The housing market continues to adjust to higher borrowing costs. The summer slowdown is now arriving, tempering activity. The timing of the first cut in the base rate is key and will give a boost to market sentiment and sales activity.
After a busy start to 2022, the market will start to move back to pre-pandemic conditions, allowing supply pipelines to rebuild. However, the demand/supply imbalance will not fully unwind, and this will be one factor supporting price growth of 3% next year.
House price growth is starting to ease, although the path over the next year will not be linear. We expect UK average price growth to end 2022 firmly in positive territory at 3%.
The impact of the pandemic has further to run. The current momentum in the market will largely offset growing headwinds over 2022 with average UK house prices increasing by 3% and 1.2m sales.

Subscribe to receive email updates.
HometrackGlobal:
Linked In: