Confirming payment details

Payment processing
Login or Sign up
Forgot password
Enter your email address and we will send you a password reset link or need more help?
UK House Price Index – October 2021
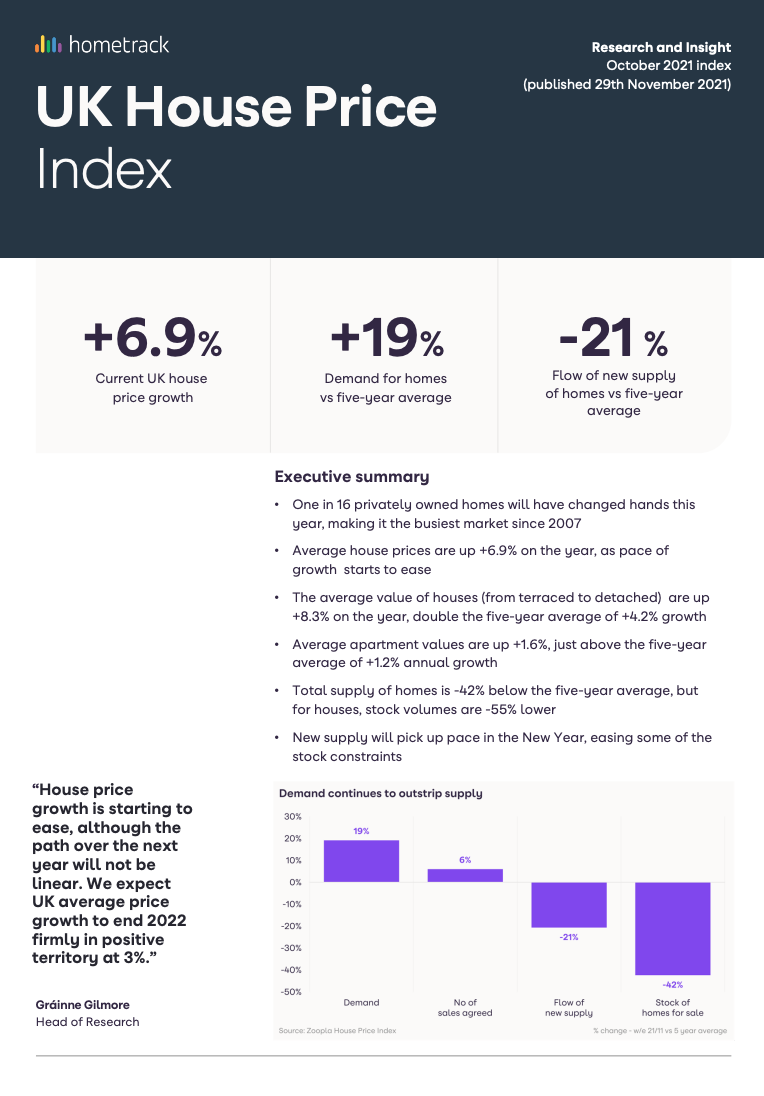
By Richard Donnell on 29 November 2021- One in 16 privately owned homes will have changed hands this year, making it the busiest market since 2007
- Average house prices are up +6.9% on the year, as pace of growth starts to ease
- The average value of houses (from terraced to detached) are up +8.3% on the year, double the five-year average of +4.2% growth
House price growth is starting to ease, although the path over the next year will not be linear. We expect UK average price growth to end 2022 firmly in positive territory at 3%.
UK house price inflation at +6.9%
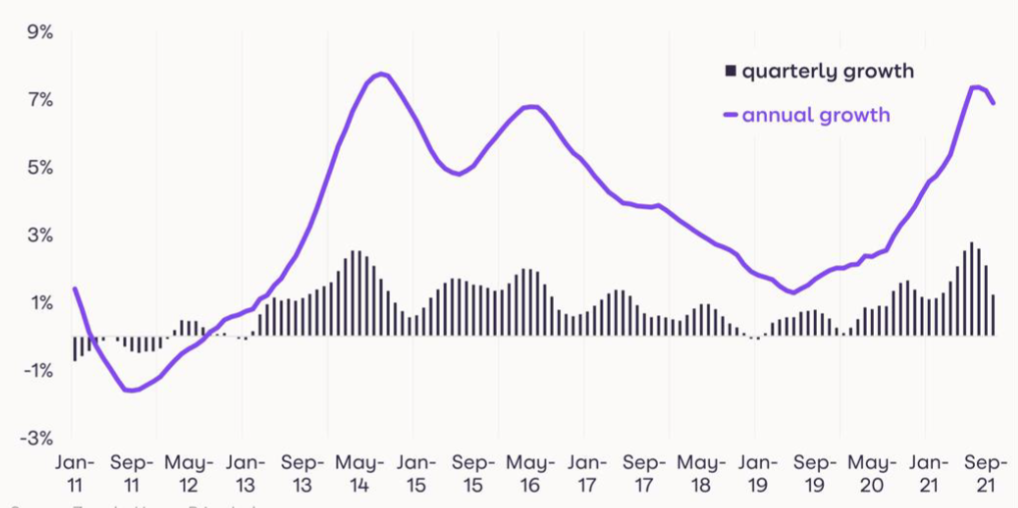
Average UK annual house price growth was +6.9% in October, up from +3.5% in October last year.
Although this is a slight easing from growth of more than +7% in August and September, the average rate of growth over the last three months is higher than at any time since 2014, underlining the strength of current market conditions.
The trend for annual growth will be a continued slowing, although the path not may be linear.
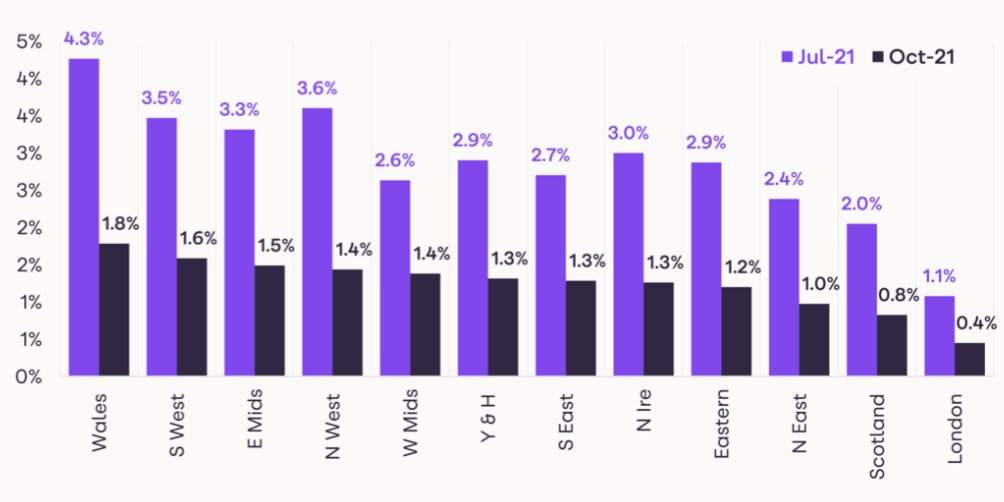
The easing in the pace of price growth is also signalled by quarterly growth slowing in October to 1.2%, half the levels of 2.8% registered in July.
Wales continues to register the highest rate of house price growth across the regions, at +10.8%, followed by the North West at +9%.
The market in London, which was most affected by the pandemic and subsequent lockdowns, is registering price growth of +2.3%.
In a sign that growth is easing across the country, quarterly price growth has also dipped compared to the late summer in all regions.
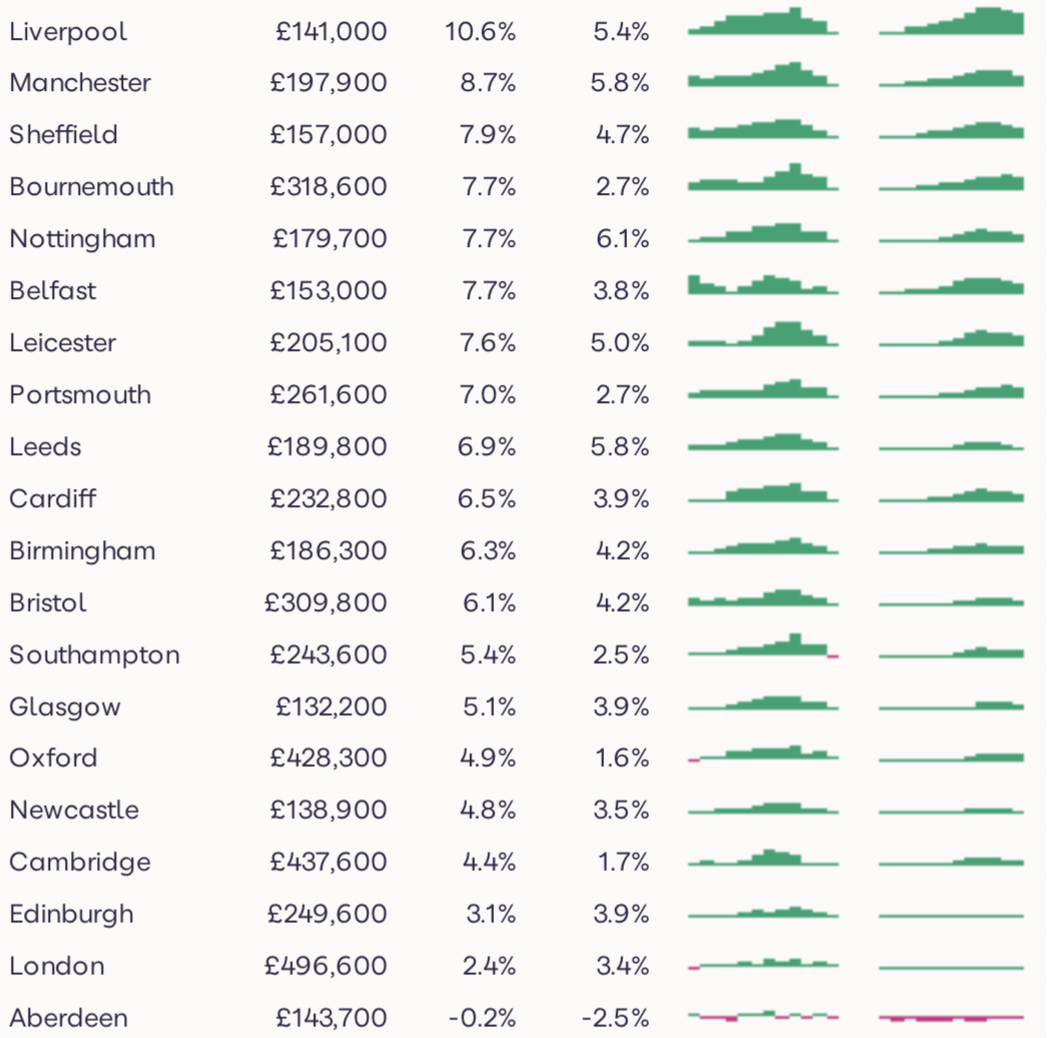
Among the UK’s largest cities, Liverpool, Manchester and Sheffield continue to show the highest rates of growth, at 10.6%, 8.7% and 7.9% respectively.
The only large city registering price falls is Aberdeen, where average values edged down 0.2% on the year. In line with our forecasts, the rate of annual house price growth is set to moderate in the coming months and into next year, although we expect prices to end 2022 firmly in positive territory at 3%.
As mentioned above, while we expect the headline index to slow, there may be monthly volatility. A key factor here is the uneven releases of official data on transactions, which will affect revisions to our index.
Supply most constrained for houses
House price growth is easing as we approach the end of the busiest market since 2007. One in 16 privately owned homes has changed hands this year, compared to one in 20 in 2019.
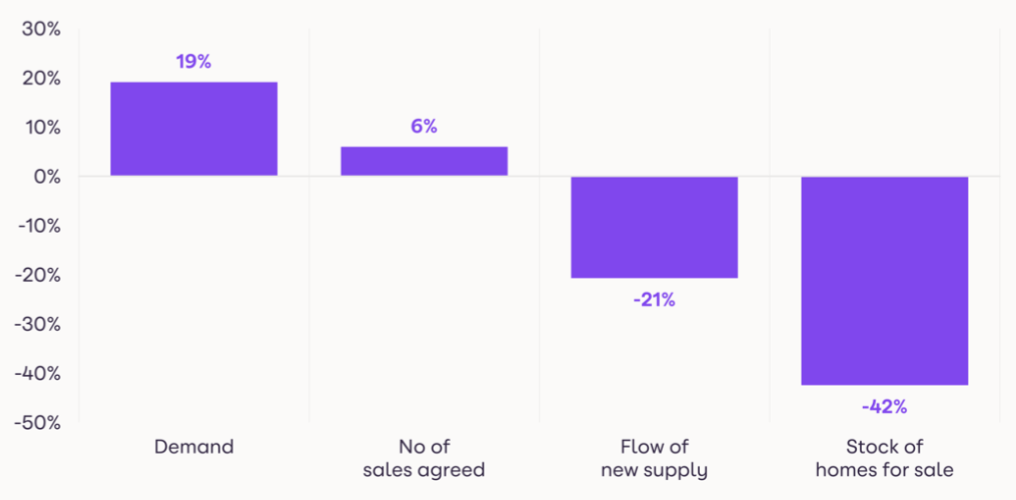
Buyer demand remains higher than usual levels - continuing to run +28% higher than the five-year average. The new supply of homes being listed for sale has been running 5% to 10% below typical levels seen in 2017-2019 for most of this year.
However, the total stock of homes for sale is down more than 40% on the five-year average. When we look at the data in more detail, the trends on stock starts to diverge between houses and flats.
The number of houses available for sale is down more than 50% compared to the average levels over the last five years. The stock of flats for sale is also down, but by a more moderate 15% compared to the five-year average.
The increased demand for, and resulting erosion of stock for houses highlights the increased appetite for space among those purchasing homes since the start of the pandemic.
There is more demand for larger homes, especially in commuter zones and more rural areas. In addition, the stamp duty holiday also boosted demand for higher value homes, with the offer of savings of up to £15,000 on the purchase.
The contrast in stock availability for houses and flats is also reflected in price growth. The average flat has risen in value by 1.6% over the last year, just slightly above the five-year average of 1.2%.
However, the annual growth in prices for all types of houses, from terraced to detached, is running at 8.3%, nearly double the five-year average rate of growth of 4.2%.
Outlook
New supply will start to rise at the turn of the year as households use the holiday period to make a decision around making a move.
In typical years, the highly seasonal supply of homes being listed for sale slows in the run up to Christmas, but rises sharply in the new year.
On average, the supply of listings at the end of January run some 50% higher than the start of December.
Those wanting to move home should contact agents in advance of the holiday period to ensure their home is ready to list at the start of 2022, to get ahead of the competition.
Buyer demand will remain strong moving into next year, but as the market starts to normalise in 2022, in terms of the mix of buyers, there may be more churn and slightly less demand from those with nothing to sell, such as investors and first-time buyers.
This should ease the constraint in supply to some extent, although continued lower levels of supply are expected to continue to underpin pricing next year.
Other factors that will affect prices next year include the looming economic headwinds in the shape of rising inflation – which will push houseshold costs higher.
The Bank of England will reply by raising interest rates, leading to mortgage rate rises, which will impact buyer sentiment, especially among those unused to rate hikes.
Even so, mortgage rates are likely to remain relatively low compared to long-run averages, and there is more room for price growth across some of the most affordable housing markets.
As outlined in our forecasts report last month, we expect house prices to rise by 3% next year, and forecast 1.2 million transactions, down from 1.5 million this year, but in line with the average number of transactions over the last five years
UK House Price Index – October 2021
By Richard DonnellRelated articles
The housing market continues to adjust to higher borrowing costs. The summer slowdown is now arriving, tempering activity. The timing of the first cut in the base rate is key and will give a boost to market sentiment and sales activity.
After a busy start to 2022, the market will start to move back to pre-pandemic conditions, allowing supply pipelines to rebuild. However, the demand/supply imbalance will not fully unwind, and this will be one factor supporting price growth of 3% next year.
The impact of the pandemic has further to run. The current momentum in the market will largely offset growing headwinds over 2022 with average UK house prices increasing by 3% and 1.2m sales.
Demand from buyers searching for space, and making lifestyle changes after consecutive lockdowns, has further to run. Balancing this however, will be the more challenging economic environment as we move into Q4.

Subscribe to receive email updates.
HometrackGlobal:
Linked In: